ML Deployment · Business Analytics
Joyston Fernandes
Aspiring ML Deployment Engineer, AutoML with H2O, Production data analyst, Forecasting & time series, Business Analytics · Class of 2026
Business Analytics student working toward ML deployment — the part after the notebook, where a model gets packaged, served, monitored, and actually used. Grounded in real production data: manufacturing yield, packaging waste, and forecasting.
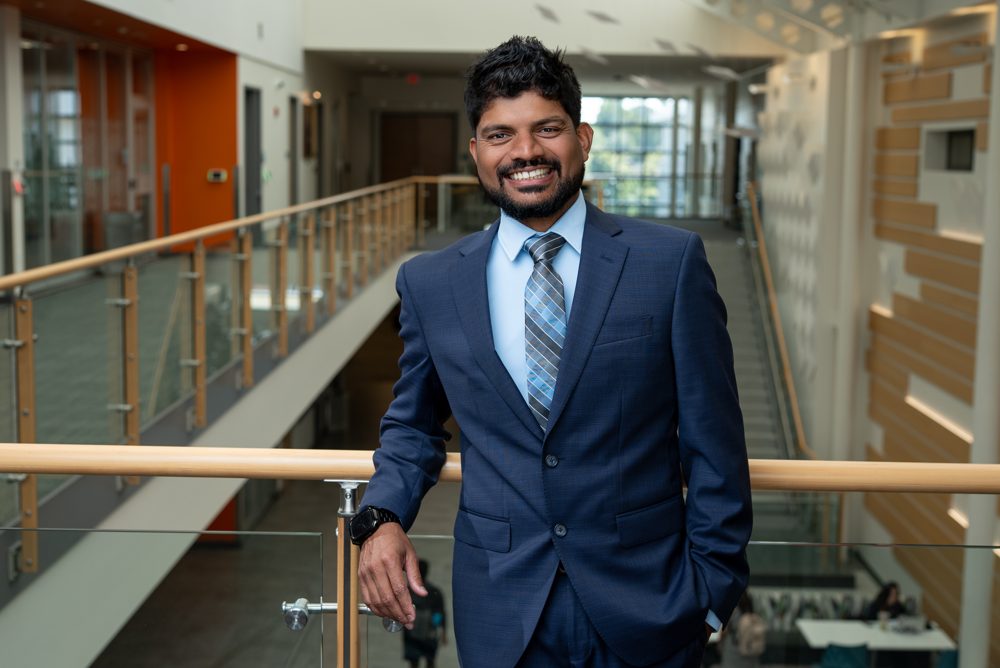
01About
From production floors to production models
Business Analytics student working toward ML deployment — the part after the notebook, where a model gets packaged, served, monitored, and actually used. Grounded in real production data: manufacturing yield, packaging waste, and forecasting.
Currently a Business Analytics student at the University of New Haven, with a Post-Graduate Program in Data Science and Business Analytics from UT Austin already behind me. My work so far has been production data analysis in food manufacturing, learning outcomes analytics in higher education, and more than a year leading a student analytics community.
What pulled me toward deployment was noticing how much of the value sits after the model is trained. A forecast in a notebook changes nothing; the same forecast running on a schedule, feeding a dashboard someone checks on a Monday morning, changes how a line gets run. That gap — packaging, serving, monitoring, retraining — is what I'm building toward.
Download Full Resume (PDF)02Now
What I'm doing right now
Updated September 2026
Working
Assurance of Learning Assistant at Pompea College of Business, and Production Data Analyst Intern at Atticus Bakery.
Building with
H2O AutoML for fast model baselines and comparison.
Learning
Java, Blender and AutoCAD, plus the deployment stack: Docker, FastAPI and MLflow.
Finishing
B.S. Business Analytics at the University of New Haven, December 2026.
03Toolkit
Skills & Systems
Tools
- Python
- R (RStudio)
- C++
- SQL
- H2O AutoML
- Power BI
- Excel (VBA)
- Git
- Visual Studio
Concepts
- Data Visualization
- Forecasting
- Relational Databases
- Basic Machine Learning
Currently Learning
- Java
- Blender
- AutoCAD
- Docker
- FastAPI
- MLflow
- CI/CD (GitHub Actions)
- Model Monitoring
- Cloud Deployment
Business Systems
- Autodesk
- SAGE
- Microsoft Dynamics 365
- MICROS
- TOUCHE
- TOAST
- IDS
- LMS-Canvas
04Timeline
Experience & Education
Assurance of Learning Assistant @ Pompea College of Business
January 2026 – Present
- Collaborate with PCoB faculty on the AACSB Assurance of Learning team, contributing to data collection and analysis for accreditation metrics.
- Support continuous improvement of program learning outcomes.
B.S. Business Analytics
University of New Haven · West Haven, CT
Expected December 2026 · GPA 3.7
Post-Graduate Program in Data Science and Business Analytics
University of Texas at Austin · Austin, TX
Completed February 2023 · GPA 3.8
Career profile on Lossdog
My resume run through Lossdog, an AI platform that benchmarks a professional profile against real Bureau of Labor Statistics wage data by metro area, education, and title.
05Leadership & Awards
Beyond the spreadsheet
President, UNewHaven Business Analytics Club
March 2025 – May 2026
- Led a student organization focused on analytics, data visualization, and career preparation.
- Organized workshops in collaboration with faculty and industry speakers.
- Coordinated event logistics, marketing, and sponsorship outreach to grow membership and club visibility.
Awards & Recognition
- Pompea College of Business – Dean's List (7x)
- Business Analytics Diplomat (2025–2026)
- Excellence in Economics (2026)
06Flagship Project
Forecasting Daily Traffic at Baregg Tunnel
Three years of daily traffic, two forecasting models, and one honest out-of-sample test.
- R
- Time Series
- Linear Regression
- Residual Diagnostics
- 1
Problem
Show that a forecasting model actually earns its complexity by beating a naïve seasonal benchmark on three years of daily tunnel traffic.
- 2
Approach
Linear regression with trend and weekly seasonality vs. a same-day-last-week baseline, tested on a held-out five-month validation window.
- 3
Result
Regression beat the baseline on all four metrics (RMSE, MAE, MAPE, MASE), and residual diagnostics confirmed the model assumptions held.
07Portfolio
Projects
3D World
No description provided.
Food Industry AMA
No description provided.
CHABASO FACILITY MUSTER
This file is a WIP application for Muster station Logging for Evacuation Drills
chabaso bakery app
A web-based tool for CHABASO Bakery team to instantly search, manage, and track 1M+ dough products
Baregg Tunnel Traffic Forecasting
Regression with weekly seasonality beat a naïve benchmark on RMSE, MAE, MAPE and MASE.
08R & Analytics
Published Reports
Statistical analysis and forecasting write-ups published on RPubs — regression, causal inference, decision trees, and time series work.
Forecasting Daily Traffic at Baregg Tunnel
Naïve vs. linear regression forecasting on 2003–2005 tunnel traffic data, capturing weekly seasonality and trend. Evaluated with RMSE, MAE, MAPE, and MASE.
Predicting House Prices
Regression modeling of house prices from square footage, location, and room count, holding other economic factors constant.
Does Job Training Really Improve Earnings?
Causal inference on the National Supported Work Demonstration dataset using propensity score matching, replicating LaLonde (1986) and Dehejia & Wahba (1999).
Hedonic Models: Factors Influencing Housing Prices
Multiple linear regression on the wooldridge hprice2 dataset, isolating the effect of crime rate on median house price while controlling for neighborhood characteristics.
Titanic Survival Prediction with Decision Trees
A decision tree model predicting Titanic passenger survival from age, sex, class, and fare, interpreted into human-readable survival rules.
NovaBrew Coffee Roaster — Revenue Prediction
Comparing linear vs. quadratic trend regression models for monthly revenue, to inform a major capital investment decision.
09Live from GitHub
Activity Snapshot
These update automatically — no rebuild needed. Served as images by the community github-readme-stats project.
10Beyond the Data
A camera, a 3D printer, and a lot of original music
Analytics is the day job. Off the clock I run Travels of Joy and Prints of Joy — cinematic travel films scored with music I write, and 3D printing built up layer by layer. Different subjects, same instinct: find something interesting, figure out how it works, and share it.
Travels of Joy
@TravelsofJoyTV
Cinematic travel films, scored with my own ambient music
Prints of Joy
@PrintsofJoy
Prints, projects, and time-lapses from a 3D printing enthusiast
11Resume
Take a copy
Tailored versions for different kinds of roles. Each one is a single PDF — no sign-up, no email gate.
Or read it as a web page →ML Deployment
Engineering-leaning version — Python, pipelines, deployment coursework, and the production data work behind it.
12Writing
From the Blog
13Get in touch
Let's talk deployment
Scan to open the live portfolio — great for a resume footer or business card.